Section 5.3 Visualizing the Data
Subsection 5.3.1 Bill Type vs. Status
We now summarize the relationships of the type of bill to its status to determine whether specific types of bills were more likely to succeed.
Note that crossing over refers to a bill being passed out of one state legislative chamber (either the State House or State Senate) and moving forward for consideration in the other chamber. Thus, a bill that has crossed over suggests majority support for the bill in at least one chamber.
##                      Bill Type Crossed Over Dead/Failed Introduced Passed
##               Drag Performance            6          11         19      0
##                     Healthcare           10          85        112      5
##                     ID Updates            4           9         15      0
##  Nondiscrimination Protections            0           6          6      1
##                          Other            8          26         38      1
##              Public Facilities            6          29         22      2
##              Religious Freedom            1          13         22      1
##            Schools / Education            8          42         47      1
##                Youth Athletics           23          70        158      3
##                          Total           66         291        439     14
##  Signed/Enacted Vetoed Total
##               2      0    38
##              17      0   229
##               5      0    33
##               0      0    13
##               4      1    78
##               7      0    66
##               4      0    41
##               4      0   102
##              35      4   293
##              78      5   893
We see what percentage of each bill status was made up of each bill type:
##                      Bill Type Crossed Over Dead/Failed Introduced Passed
##               Drag Performance        15.8%       28.9%      50.0%   0.0%
##                     Healthcare         4.4%       37.1%      48.9%   2.2%
##                     ID Updates        12.1%       27.3%      45.5%   0.0%
##  Nondiscrimination Protections         0.0%       46.2%      46.2%   7.7%
##                          Other        10.3%       33.3%      48.7%   1.3%
##              Public Facilities         9.1%       43.9%      33.3%   3.0%
##              Religious Freedom         2.4%       31.7%      53.7%   2.4%
##            Schools / Education         7.8%       41.2%      46.1%   1.0%
##                Youth Athletics         7.8%       23.9%      53.9%   1.0%
##                          Total         7.4%       32.6%      49.2%   1.6%
##  Signed/Enacted Vetoed  Total
##            5.3%   0.0% 100.0%
##            7.4%   0.0% 100.0%
##           15.2%   0.0% 100.0%
##            0.0%   0.0% 100.0%
##            5.1%   1.3% 100.0%
##           10.6%   0.0% 100.0%
##            9.8%   0.0% 100.0%
##            3.9%   0.0% 100.0%
##           11.9%   1.4% 100.0%
##            8.7%   0.6% 100.0%
And what percentage of each bill type had each status:
##          Status Drag Performance Healthcare ID Updates
##    Crossed Over             9.1%      15.2%       6.1%
##     Dead/Failed             3.8%      29.2%       3.1%
##      Introduced             4.3%      25.5%       3.4%
##          Passed             0.0%      35.7%       0.0%
##  Signed/Enacted             2.6%      21.8%       6.4%
##          Vetoed             0.0%       0.0%       0.0%
##           Total             4.3%      25.6%       3.7%
##  Nondiscrimination Protections Other Public Facilities Religious Freedom
##                           0.0% 12.1%              9.1%              1.5%
##                           2.1%  8.9%             10.0%              4.5%
##                           1.4%  8.7%              5.0%              5.0%
##                           7.1%  7.1%             14.3%              7.1%
##                           0.0%  5.1%              9.0%              5.1%
##                           0.0% 20.0%              0.0%              0.0%
##                           1.5%  8.7%              7.4%              4.6%
##  Schools / Education Youth Athletics  Total
##                12.1%           34.8% 100.0%
##                14.4%           24.1% 100.0%
##                10.7%           36.0% 100.0%
##                 7.1%           21.4% 100.0%
##                 5.1%           44.9% 100.0%
##                 0.0%           80.0% 100.0%
##                11.4%           32.8% 100.0%
It seems like bills related to “ID updates” (i.e., preventing trans and nonbinary people from having their IDs show their correct gender identity), “public facilities” (often preventing trans people from using the bathroom that fits their gender identity), and “youth athletics” (i.e., preventing trans girls from competing on girls' sports teams) are most likely to be signed by their state's governor and enacted into law (after passing both legislative chambers).
However, of all the bills that were signed and enacted, most of them by far were related to youth athletics (over double the number of bills from any other category), followed by healthcare, suggesting that more bills were proposed in those categories.
We seek to represent this data in a side-by-side bar chart. In order to provide a more digestible, big-picture viewpoint, we classify the bills by the type of gender-affirming care that is targeted: social transition (excluding artistic performance, which Track Trans Legislation categorizes under
Drag Performance), healthcare/medical transition, drag performances (noting that performing in drag and being transgender are distinct, though sometimes overlapping, categories), and Other.
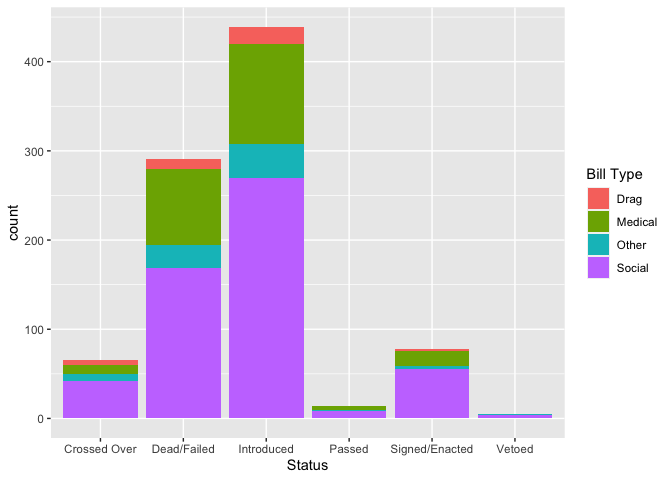
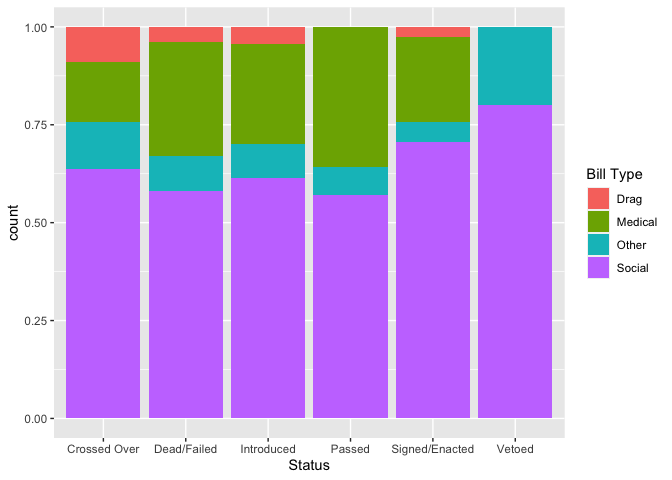
In order to better see proportions, we also show a stacked bar chart that scales every x-axis group to 100%:

Subsubsection 5.3.1.1 Did the type of bill impact its likelihood of being passed and/or signed?
However, the observed trends could simply relate to the fact that the largest numbers of bills nationwide were proposed in those categories.
In order to simplify the following charts and analysis, we combine certain bill statuses into categories: bills that have crossed over, passed, or were signed and enacted have a significant chance of impacting the lives of trans and nonbinary people in that state, while bills that were vetoed, died, or failed have no chance of impacting lives. Bills listed simply as “introduced” may or may not have the support to eventually pass, but since they are not currently impacting the ability of trans/nonbinary people to access healthcare, play sports, etc., we count them as “Not Passed”.
Now, we want to see a breakdown of the number and percentages of each type of bill that did and didn't pass.
##  Bill Type Not Passed Passed Total
##       Drag         30      8    38
##    Medical        197     32   229
##      Other         65     13    78
##     Social        443    105   548
##      Total        735    158   893

##  Bill Type Not Passed Passed
##       Drag      78.9%  21.1%
##    Medical      86.0%  14.0%
##      Other      83.3%  16.7%
##     Social      80.8%  19.2%
##      Total      82.3%  17.7%
We wish to plot the number and proportion of each type of bill that was passed.
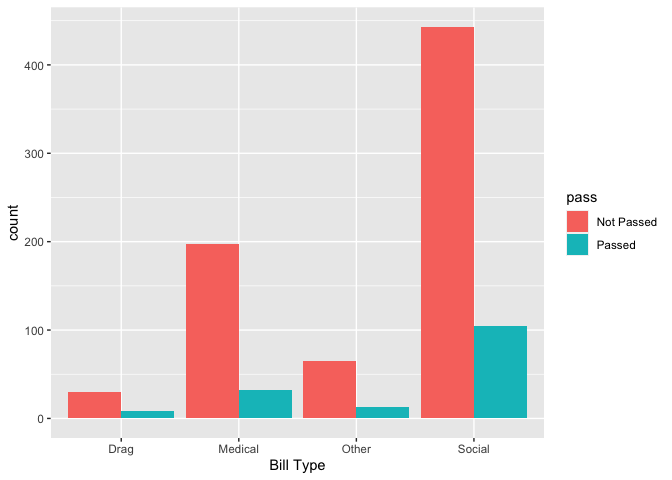
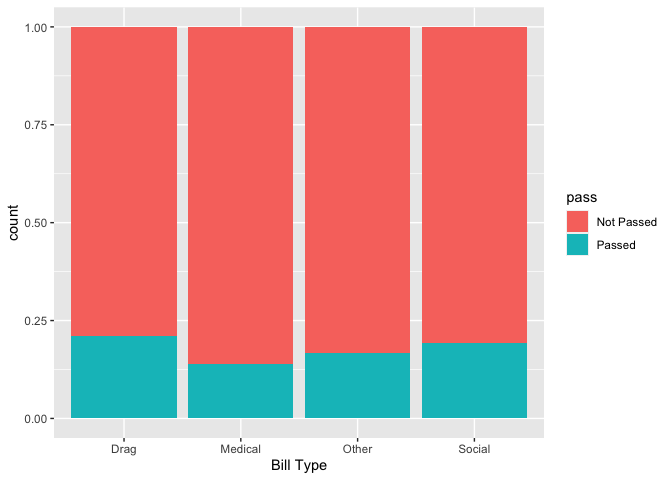
From this chart, it appears that bills restricting hormone therapy, puberty blockers, and other medical interventions are actually somewhat less likely to pass than other types of bills, and that while the number of anti-drag bills is substantially smaller than the number of other types of bills, they are somewhat more likely to pass.
Importantly, fewer than 25% of any type of bill since 2018 has passed. What happens when we break down the bills by year?
Subsection 5.3.2 Is 2023 the Year of Transphobia?
A common claim in the news media, and a common feeling among trans and nonbinary folks, is that 2023 is by far the worst recent year for anti-trans legislation. Let's investigate the following questions:
- What total number of anti-trans bills were proposed each year from 2018 to 2023?
- What total number of anti-trans bills were passed each of these years? In 2023, since the session is not over in many states, we run the analysis in two ways: including both bills that crossed over and bills that were signed/enacted, and only considering bills which were signed/enacted.
- What types of anti-trans bills were proposed more often in 2023 than in previous years?
- What types of anti-trans bills were passed more often in 2023?
- What states introduced/passed the majority of anti-trans bills in 2023, and are these the same states as in previous years?
We start by creating a data frame that shows only the bills passed, crossed over (hence passed by at least one chamber of the legislature and not yet dead), and/or signed and enacted between 2021 and 2023, as well as in each year and in the years preceding 2023.

Note that these bills only go through April 21, 2022. To emphasize the change in the number of bills that have a chance of passing or have already been passed over time, we combine all the years 2017-2022 and compare them to 2023.
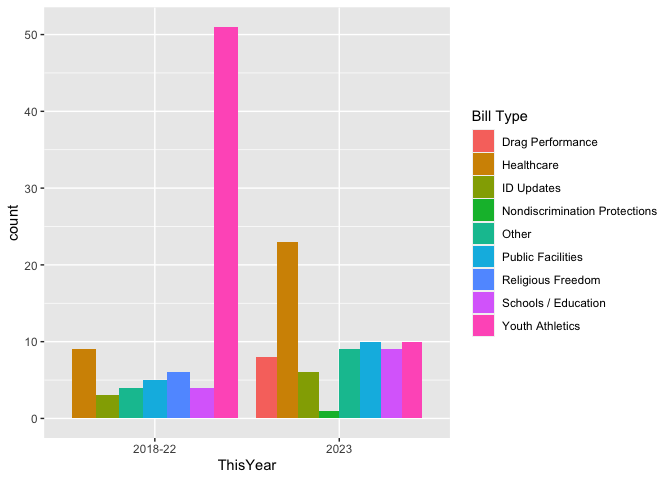

It appears that 2023 will, indeed, have many anti-trans bills pass than all previous years since 2018 combined (again, recall that the 2023 data in this analysis only goes through April 21, 2023). What about the likelihood of any particular anti-trans bill to pass in 2023 compared to previous years?

There appears to be a slight increase in the proportion of bills of all types that passed in 2023 compared to 2018-22. This difference becomes even more pronounced when we separate 2022:
##  after_21 Not Passed Passed
##   2022-23      78.2%  21.8%
##   2018-21      84.7%  15.3%
##     Total      80.1%  19.9%

